| Public Courses | |||
| $475 | 1 Day Group discounts available |
||
| Times | 9:00am - 4:30pm | ||
| Reference | Hosted manual included or Purchase printed book |
||
| Certificate | Attendance or Completion upon assessment |
||
| Live Online |
Hands-on, Live Instructor Dedicated Training Platform |
||
| Private Courses | |||
| Classroom | Group Training (hired room) Get a Quote |
||
| In House | On your site Get a Quote |
||
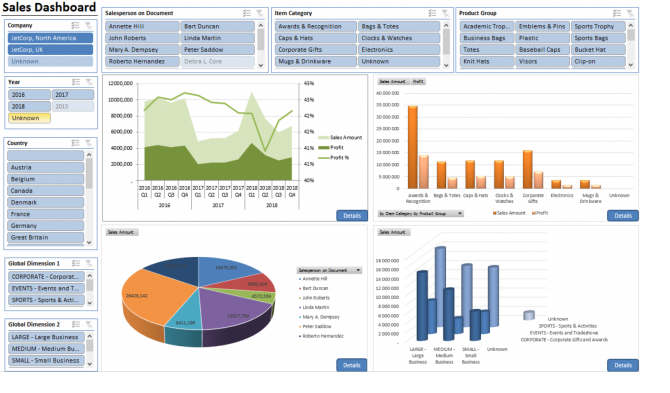
Excel Dashboards
Every business can benefit from using a dashboard.
4.7 (1,545 reviews)
$475
Brochure
Excel dashboards aggregate and transform large volumes of data into succinct visual content which is easily understood.
With an interactive dashboard, users can filter data, interact with charts to see changes over time and even display different components for on-the-fly. That means you can get as much or as little detail on specific metrics as you want.
Course Details
In the Excel Dashboard training course you will learn how to leverage Excel functionality to build and manage sophisticated interactive Excel dashboard to improve your reporting.
Provide a visual overview of key metrics extracted from the data
Gather data from multiple sources into a single interface
Provide transparency by drilling down into the data
Build interactivity to filter data, update charts and see changes over time
Audience:
Current users of Excel who wish to design visual dashboards and summary reports in Excel.
Prerequisites:
Intermediate level skills. You do not need to be an Excel guru however you must have a sound knowledge of formulas, cell references, filtering and sorting data and creating simple charts.
Course Content
Introductions
- Overview of dashboard reporting
- Understanding the purpose of the dashboard
- How will the dashboard be used?
- Dashboard Design Principles
- Organising your data
Analysing Data
- Lookup functions
- Vlookup(), Hlookhup()
- Sumproduct function
- Choose() function
- Using Excel Lists/Tables to manage data
Advanced Chart Techniques
- Creating Mini Charts
- Managing Legends and X/Y axes
- Using Secondary axes
- Adding Autoshapes to a chart
- Creating Dynamic text boxes
- Creating better charts in Excel
Excel Camera Tools
- Using the Camera tool
- Creating dynamic Charts
Showing Trends
- Line chart trends
- Area chart trends
- Vertical scale
- Showing side-by-side comparison
- Marking significant events
- Representing forecasts
- Creating a sparkline
PivotTables
- Using pivot tables to create interactive views
- Creating a histogram with a pivot table
- Highlighting top values
- Using external data with PivotTables
Performance against target
- Thermometer style charts
- Bullet graphs
- Creating qualitative bands
- Performance against a target range
Designing an Interactive Interface
- Using Data validation and in-cell lists
- Adding a check box to include a trendline
- Using Option buttons to dynamically feed data
Final Project
- Putting it all together.
- Using functions to pull data into charting tables.
- Designing the Mini-chart format.
- Setting up the Dashboard layout